What is PE Ratio:-
PE Ratio is Price to Earnings Ratio or Price to Earnings Multiple. It is the ratio of a company’s share price to its earnings per share (EPS). EPS is calculated as the Company’s Net Income divided by the Total Number of outstanding shares.
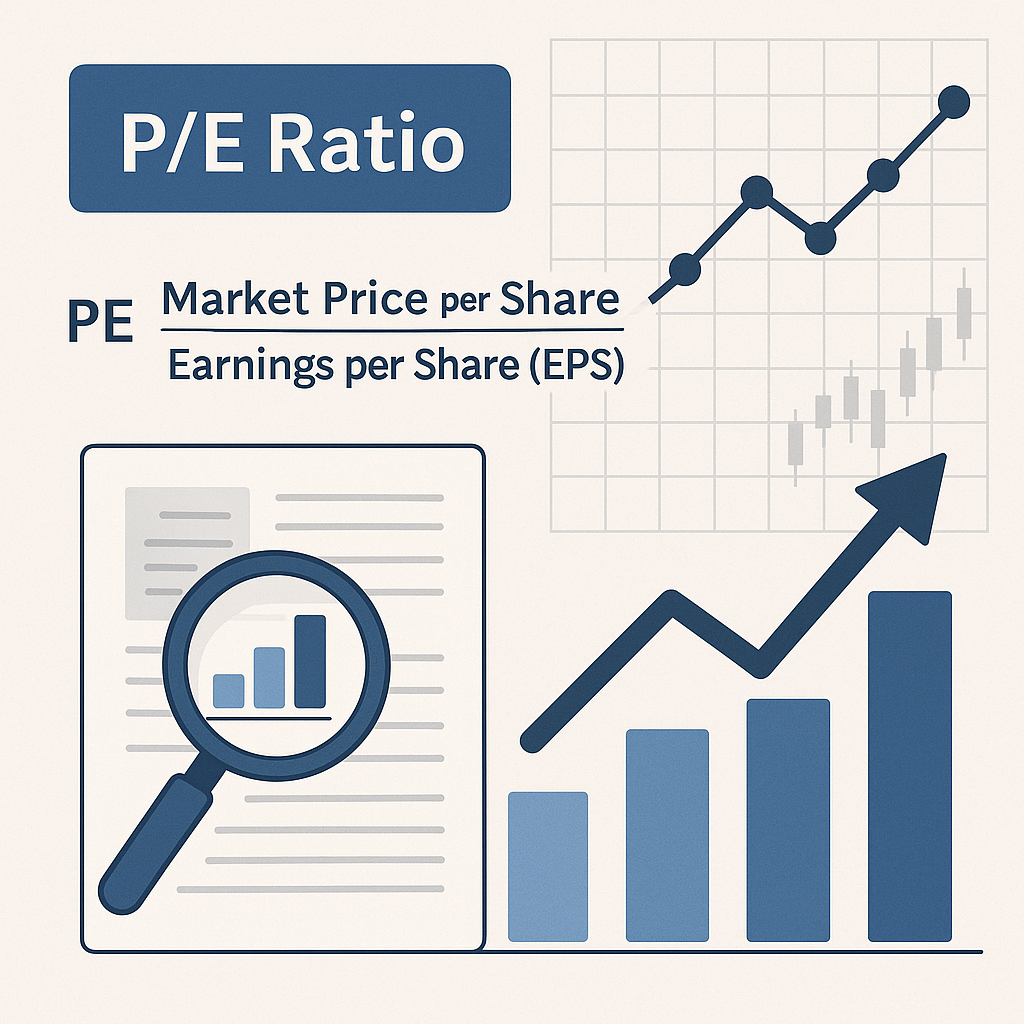
PE Ratio = Companies Share Price ÷ EPS (Earning Per share)
The full form of EPS is Earning Per Share.
EPS = Company’s Net Profit ÷ Total Number of Outstanding Shares.

What the PE Ratio tells us:-
The PE ratio is the most widely used while determining the correct price valuation of a Company’s stock. It helps investors to judge whether the stock is undervalued, overvalued, or fairly valued. The PE Ratio is the number of times an investor is willing to pay as compared to its earnings. In simple terms, the PE Ratio is the price the investor is ready to pay to purchase Rs. 1 EPS of the company. The P/E ratio is very useful in making the right investment decision.
In a broader sense, a Higher PE Ratio indicates that the company’s stock is overvalued. A lower PE ratio indicates that it is fairly or undervalued. It is not a thumb rule that a high PE ratio is always bad. High-performing company may have a high PE Ratio, but it is not a bad idea to purchase that share because it is an exceptionally performing company. It is worth buying that company’s share even at a high PE Ratio. It is very easy to find the PE Ratio of a Stock by going to any financial website like Money Control, Groww, ET Money, or Zerodha.
Types of PE Ration:-
The most widely used PE Ratios are
- Forward PE Ratio: Current price of a share divided by projected future EPS of the company for 1 Year (4 Quarters)
- Trailing PE Ratio: Current price of a share divided by Trailing EPS of the last 1 year (4 Quarters).
The trailing PE Ratio is more accurate than the Forward PE Ratio because the Trailing PE Ratio is based on realistic past data. Whereas the Forward PE ratio is based on projected data. But both can be used for analyzing the stock valuation.
What is a good PE Ratio:-
PE ratio by Rs. -2. Whereas TCS share is somewhat overvalued by Rs. 2.
PE Ratio of Nifty
Just like the investor compares the PE Ratio of a particular stock with another company’s PE Ratio or with the Industry PE ratio to find out the real valuation of the stock. We can compare the PE Ratio of Nifty with its past PE Ratio, to find out whether the Nifty is overvalued or undervalued.
We can apply it to judge the overall valuation of the market, whether it is undervalued or Overvalued. The average PE Ratio of Nifty is “20”. A PE Ratio below 15 is called as undervalued. A PE Ratio above “25” indicates that Nifty is overvalued. When the value of the Nifty PE Ratio is between 16 to 20, the market is fairly valued.
PE Ratio of Nifty from the Last 25 Years
CONCLUSION.
1..PE Ratio is the price the investor is ready to pay to purchase Rs. 1.00 EPS of the company. Suppose the PE ratio of the company is 20. This means the investor is ready to pay Rs. 20 for 1.00 EPS of the company.
2. PE Ratio = Companies Share Price ÷ EPS (Earning Per share)
3. The full form of EPS is Earnings Per Share.
EPS = Company’s Net Profit ÷ Total Number of Outstanding Shares.
4. Types of PE Ration:- 1. Forward PE Ratio 2.Trailing PE Ratio
5. Whether the PE Ratio is good or bad can be determined by comparing it with the PE Ratio of another stock of the same industry or with the Industry PE Ratio.
6. The average PE Ratio of Nifty is 20. A PE Ratio below 15, the Market is undervalued, and a PE ratio above 25, the Market is overvalued. Between 16 to 20, it is fairly valued.
The reader will also like to read about the following topics
4. Bull vs Bear Phase in the Stock Market
5 . XIRR vs CAGR vs Absolute Return
6. Nifty 50 vs Nifty Next 50 vs Nifty 100
7. Top 5 gold ETF funds in India